


Products
Interactive Chart
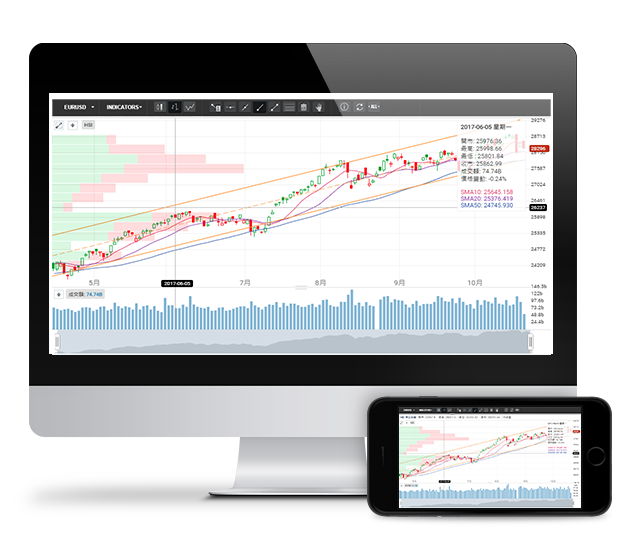
m-FINANCE is one of the pioneers in the market to provide the HTML5 Interactive Chart for financial institutions. Besides many basic and comprehensive functions, it also features Undisposed Losing Zone and Trend Line Zone, helping clients to analyze the coming entry and exit time.
Feature

Mobile Charts
Accessible from smartphones, tablets and other mobile devices

Undisposed Losing Zone
An indicator derived by trends, directions and price concentration zone of asset prices within a set period. It helps to locate important price zones on charts as a reference for entry and exit

Trend Line Zone
A chart signal derived from precise statistics, history of asset prices and other indicators and data, which helps to locate resistance and support levels

Multiple Technical Indicators
Various technical indicators provided, including Bollinger Band, RSI, Williams %R, and a full toolkit of advanced drawing tools including Fibonacci Retracement and Annotation